Frank van Steenbergen, Nizar Zaied and Femke van Woesik
In the Middle East, North Africa (MENA), and Sub-Saharan Africa (SSA), water scarcity has emerged as a pressing concern for many Islamic Development Bank (IsDB) member countries. Alarmingly, nearly 40% of the IsDB member countries (22 out of 57) face physical water scarcity, with availability dropping below 1000 cubic meters per capita per year. Additionally, 16 countries experience economic water scarcity, with levels below 3000 cubic meters per capita per year (Molle et al., 2017).
With 80% of water resources allocated to agricultural activity (IsDB, 2019), escalating water scarcity poses a profound threat to this sector. The Arab Climate Change Assessment report further accentuates the severity, indicating that a substantial portion of cropland in the Arab region’s key agricultural systems, encompassing crucial crops like wheat, maize, and olives, resides in the highest vulnerability brackets (ESCWA, 2017). In return, this underscores the imperative for the agricultural sector, being a major water consumer, to actively engage in mitigating its water footprint.
Within this water scarcity issue, a great concern is the over-reliance on groundwater. Coupled with suboptimal water efficiency, this results in a depletion of groundwater storage in over two-thirds of the Arab regions. Projections paint a bleak future, with available groundwater per capita expected to halve by 2050 compared to the turn of the century (ESCWA, 2017).
The urgency of these trends cannot be overstated. It is not merely about water security but a broader overall security issue. The IsDB recognized this critical issue in its 2020 Water Policy, which emphasizes to enhance water use efficiency. Experts concur that a 25% increase in water productivity in agriculture, where the highest gains can be made, is feasible (ISDB Water Policy Pillar 2, 2020).
Leveraging big data from the FAO WaPOR database[1], this blog dissects the trends in agricultural water consumption, biomass production, and water productivity across selected IsDB member countries.
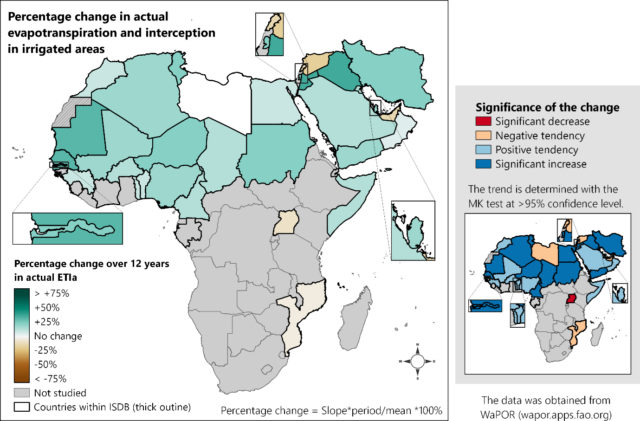
Figure 1 highlights the shift in actual evapotranspiration and interception within irrigated regions, indicating water consumption. Results reveal a notable increase of more than 25% over 12 years. The rise is primarily attributed to increased groundwater utilization in MENA nations and surface water usage in Sub-Saharan African countries. In some countries reuse of waste water is a trend as well.
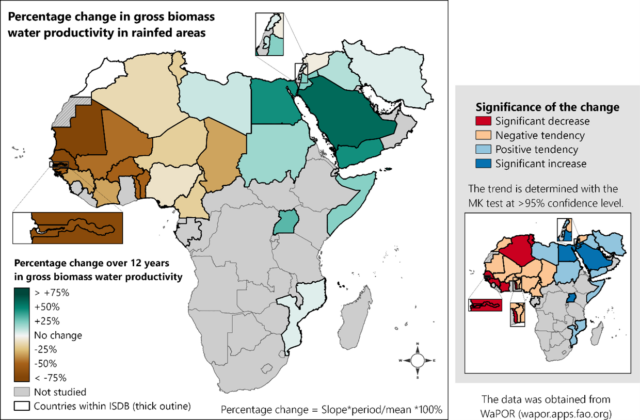
While irrigation water consumption has surged across most countries, the correlation with biomass production varies. Figure 2 illustrates the shift in biomass water productivity within irrigated regions. MENA countries show a proportional increase in both. In contrast, in SSA countries, there is a marked decline in biomass production alongside rising evapotranspiration.

The increase in water consumption, coupled with declining biomass production for some countries, prompts a critical evaluation of water productivity, often quantified as ‘crop per drop’. Alarmingly, 18 out of 33 countries demonstrate a reduction in water productivity, indicating a diminishing yield of crops for the same volume of water input. This trend calls for targeted interventions to improve agricultural water management strategies.
In rainfed areas, comparable patterns emerge (Figure 3). West African countries exhibit a concerning negative trend, exacerbated by climate change. In contrast, countries east of MENA demonstrate a more positive trajectory.
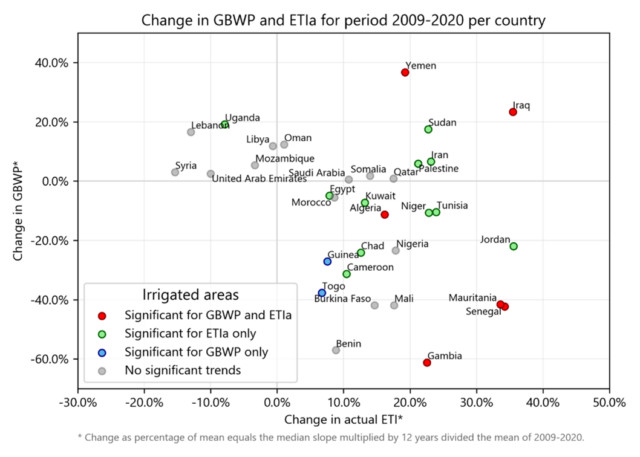
Figures 4 and 5 provide an overview of all countries and their trends in water productivity or crop per drop (GBWP) and the actual water use (ETIa). Countries displayed in the upper half show an increase, whilst countries displayed in the lower half show a decrease in agricultural water productivity. The countries in the lower right quadrant show the most alarming trend: an increased evapotranspiration that does not correspond with an increase in gross biomass water productivity. In other words, here more water is being used to produce less crops.

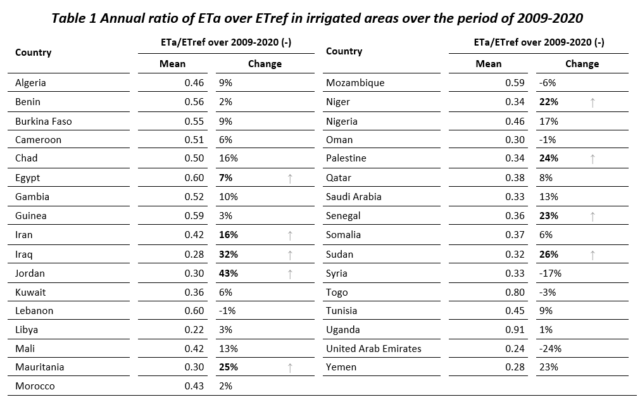
These alarming trends demand immediate attention as we are in the midst of a crisis. The increase in actual evapotranspiration is only partly explainable by increasing temperatures and higher evapotranspiration rates due to climate change. The ratio of actual evapotranspiration to reference evapotranspiration (ETa/ETref) serves as an indicator of how closely actual evapotranspiration aligns with the atmospheric demand, which represent the climatic conditions. In other words, this ratio helps us understand whether a higher or lower actual evapotranspiration could be driven by a change in the climatic conditions. If the ratio increases, this suggests an increase in water consumption beyond compensating for a change in climate. This is the pattern for almost all countries – 27 out 33% – with the increase in most cases quite substantial partly in some of the most water stressed countries, like Iran, Iraq, Jordan, Palestine, Sudan. Mauretania and Yemen. Table 1 shows the change in annual ratio of ETa/ETref in irrigated areas over the period of 2009-2020. As for most countries the Eta/ETref increased, it becomes evident that the water use in irrigated areas increased beyond compensating for the effects of climate change.
In most countries, it indicates that water stress is not halted at all. Moreover, agricultural production lags behind population growth in nearly every country, eroding food security, underscoring the critical need for substantial enhancements in water productivity.
What is evident is that we have struggled to maintain the previously stressed conditions. While climate change is a factor, it only accounts for a fraction of the larger narrative. Urgent and targeted action is imperative to safeguard our (agricultural) water resources for the future.

References
ESCWA (United Nations Economic and Social Commission for Western Asia). (2022). ESCWA Water Development Report 9: Groundwater in the Arab Region. United Nations.
Islamic Development Bank. (2019). IsDN in Brief: 1975-2019 https://www.isdb.org/sites/default/files/media/documents/2019-02/IsDB%20in%20Brief%201.5.pdf
Molle, F., Closas, A., Al-Zubari, W. (2017). Governing groundwater in the Middle East and North Africa region. In Advances in groundwater governance (pp. 527-553). CRC Press.
[1] Based on remote sensing data, 10-day intervals, and resolutions varying from 100m to 250m throughout 2009-2020, dubious pixels are out-filtered.