By Shaira Rahman (Friendship NGO) and Mst Jannatul Naim
This blog is part of a dossier on locally-led adaptation, featuring insights and lessons from the Reversing the Flow (RtF) program. RtF empowers communities in Bangladesh, Burkina Faso, Ethiopia, Kenya, and Sudan to build climate resilience through direct funding and a community-driven, landscape approach.

If we travel north Bangladesh toward Kurigram, the highway ends before the story really begins. From there, we have to follow the river named the Brahmaputra, also called the Jamuna downstream, by wooden boat, through a maze of sandbars and water channels that rearrange themselves every monsoon by erosion and accretion. The “chars” here are not fixed villages on firm ground; they are temporary agreements between land, water, and time.
A triangle relation between river, landscape and community
In Shaheber Alga Union of Ulipur Upazila, Kurigram, twenty such chars are home to communities who, together with the local NGO Friendship, are bringing the Reversing the Flow (RtF) programme to life through practical landscape restoration. Here, the landscape is not a fixed line on a map, but a shifting system shaped by the river, people’s livelihoods, and a changing climate.
On these chars, the Brahmaputra River does not simply flow past; it cuts away homesteads and fields in some places while building new sandbars in others, deciding where people can live and how long a village will last. At the same time, the river remains a lifeline, leaving behind fertile silt, fish, and grasses that support food, income, and handicrafts.
Through RtF, communities work with this reality rather than against it. They raise plinths, plant trees, reinforce banks with bamboo, and build more climate-resilient roads and markets, treating the river as a powerful neighbor to understand and negotiate with, while defending their right to stay on the land.
How people know their landscape is changing
When communities talk about “result,” they are looking beyond simple counts of plinths raised or trees planted. They want to understand whether their landscape is holding together for longer and staying safe for their families. In practice, this means asking how many seasons a sandbar can survive before erosion, and how long homesteads, WASH points, and fields can remain secure on it. For them, a strong result is a char that withstands more monsoons, offers more years in one place, and reduces the fear of sudden loss.
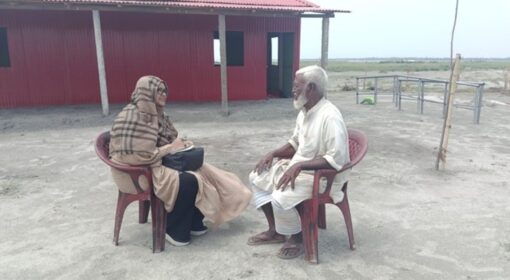
For char communities, “measuring change” in the landscape does not start from spreadsheets or river-based data; it starts from traditional knowledge and a lifetime of living experience as a riparian community. They do not need hydrological graphs to understand when the water is rising faster, when erosion is getting worse, or when the flood will stay longer. Instead, they read dozens of small, precise signs that only make sense to people who have watched this river every day for years. They watch the river current closely, how fast it is moving, which way it swirls around a bend, exactly where the water begins to undercut the bank. They observe the pattern and timing of when big chunks of mud break off and slide into the river and at what angle the bank starts to “bleach” and crack, because a steep, vertical cut means homes might fall within days, while a sloping edge suggests slower erosion. They notice whether the birds and rats still have nests in the tiny holes at the face of the riverbank; if those nests disappear or collapse, it is a warning sign that the bank is weakening from within.
Flood levels are tracked in equally grounded ways. Families remember the exact height of last year’s water by the stains it left on tin walls, bamboo posts or tree trunks with “sheded” waterlines that become a living archive of flood history. They count how many tubewells went underwater, how many days the yard stayed flooded, how long children could not reach school, how long cooking had to be done in boats or on raised platforms. Women, children and older people carry detailed memories of which paths disappeared first, which houses were the hardest to reach with food, which latrines became unusable. These stories and marks guide very practical decisions: what height to raise a homestead plinth before the next monsoon, where to place a new tube well, how to arrange assets so that fewer things are lost when the water comes again.
Also, the community considers some important indicators for social inclusion, like whether women have more voice in their RtF activities, who are the most vulnerable one has incorporated in community meetings, and who need the most.
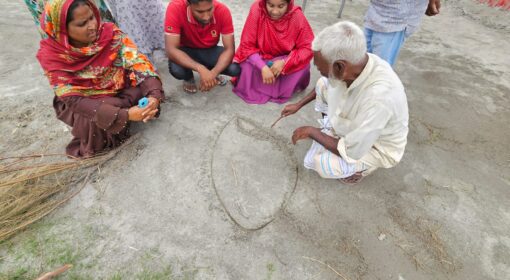
Within the RtF process, communities prepare their annual workplan each year by turning this knowledge into a participatory needs assessment they call Charer Somossa Chinhitokoron (identifying char problems). They do this before any planning and budgeting, so priorities start from their own analysis of risk and opportunity. The assessment is usually done through three focused groups formation are -landscape, water, and livelihood. Each group is responsible for identifying local issues, sharing them in Community Implementing Committee(CIC) meetings, and drawing a rich map of problems and possible solutions. Community members sometimes invite the hub team to these sessions for advice and technical support. The final rich map or drawing is then reviewed and validated in PSC meetings to guide fair fund disbursement and reduce overlap between activities.
When community members speak, they are often articulating results in ways that formal frameworks struggle to capture. As Community Implementing Committee (CIC) member Rebeka reflects, “this year we slept fewer nights in water because of the plinth,” while another community member, Ambor Ali, shares, “this year we can save our cattle from flood water.” These personal stories are the indicators of change for them.

Measuring RtF Results and Implementation in the Landscape
Communities themselves set the standards for measuring results. They begin with a participatory needs assessment to make the annual plan, then track progress against it using before/after photos, meeting resolutions, shared experiences, and simple record books used for meeting resolutions, bill vouchers, draft plan, crop calendar, etc.
Water and ecosystem health
What communities look for
- WASH points that still work during floods, with tubewells raised and floating latrines, community bath.
- Fewer accidental cases during floods, such as snake bites, child deaths, and health emergencies.
- Reduced waterborne illness during the monsoon, as reported in CIC meetings.
- Survival of trees and plants along erosion-prone river edges.
How they track it
- Sharing experiences and agreeing on resolutions in CIC meetings.
- Visual transect walks during monthly CIC meetings to see what has changed.
- Comparing observations with the annual plan map prepared during needs assessment.
Climate resilience
What communities look for
- Households that need to move when the water rises.
- Market days that continue even during flood periods.
- How quickly are funds being reallocated when a new hazard appears.
- The number of homesteads and shelters are now sitting safely above flood level.
How they track it
- Entries in the CIC resolution book documenting decisions to reallocate funds.
- Bill vouchers that match those reallocated expenses.
- Photos of raised plinths and market structures at the peak of the flood.
Livelihoods resilience
What communities look for
- Inclusion of the most vulnerable families in the community under livelihood activities.
- Whether income continues during the flood months.
- Food availability during lean and flood seasons.
How they track it
- Household-level needs assessments (to identify the empty space around homestead for gardening, available resources, which help them to draw their seasonal crop calendar and choose the climate resilience agriculture technique) and seasonal crop calendars.
- Sharing sessions where women describe how their income has changed.
- Photos of flood-resilient vegetable plots and raised market stalls.
- Exchange visits between chars to compare practices and results.
| Result tracking tools | What it captures | Who uses it |
| CIC monthly meetings | Real-time progress, problems and implementation approach corrections | CIC members, community |
| PSC quarterly meetings | Oversight and validation of activities and budget planned by CICs by greater RtF communities, Local government alignment | CIC, PSC, Government Friendship |
| Resolution book | Enlisted issues, recommendations, decisions and progress | CIC, community, PSC |
| Bill voucher records | Accountability between CIC and the community | CIC treasurer, shared in CIC meeting, PSC, community |
| Before/after photos | Visible landscape and infrastructure change | Community, Hub, Donor |
| Need assessment | Transect work, experience sharing-community discussion, annual plan baseline, social map, seasonal calendar | Whole community |
| Exchange visits | Cross-char learning, adapting good practice | RtF communities |
A view from the sky: satellite maps with char communities
Communities see that satellite maps, using simple remote sensing, can help them in very practical ways. People already read the river with their own eyes and memory, but a view from the sky becomes a quiet second pair of eyes that can confirm and sharpen what they know. These maps show how each char changes shape year by year, where the river is cutting land fastest, and where new land is forming. They can also validate community memories of “big erosion years” such as before the Corona period, turning lived experience and assumptions into something they can see on paper. With support from the hub, printed maps are brought into community meetings so everyone can see the whole river landscape together. People can then spot where the river is starting to widen, which chars are already in danger, and which areas may be safer to shift, using this early warning to place future landscape activities more wisely.
The RtF journey on these twenty chars shows that when communities are trusted with knowledge, resources, and decisions, they do far more than survive the river; they learn to live alongside it with dignity. And perhaps that is the truest measure of change: a landscape that still shifts each monsoon, but a people who no longer shift with fear.