by Francesco Sambalino and Esmee Mulder
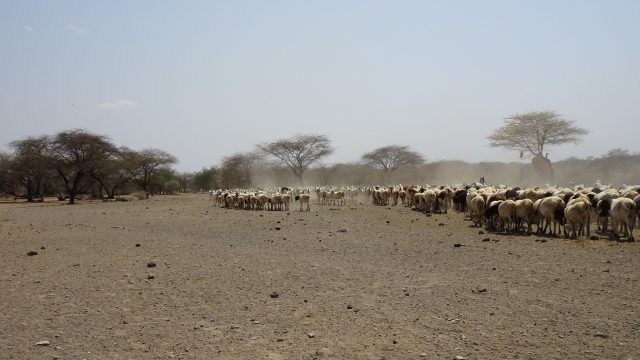
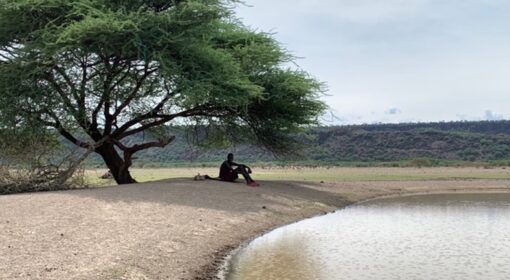
Open rangeland in Africa is arguably the most iconic landscape on the continent. In eastern Africa, it is synonymous with savannah ecosystems. Barring the sanitized national parks, set up in colonial times to drive out pastoralist communities that always coexisted with wildlife, Masai people have always coexisted with wildlife. Cattle would graze with the wildebeest and drink alongside zebras.
Movement is crucial, and only open spaces allow it. Variability in water and grass is the drumbeat that sets the tempo of a complex dance of people, livestock, and wildlife through the landscape.
When it rains, natural depressions and small reservoirs provide water for a couple of months. This opens up the wet season grazing areas to both wildlife and livestock. Grass without water is of little use. Therefore, when this temporary supply of water dries out, everyone moves back to the rangeland where water is available year-round and where, in the meanwhile, grasses, shrubs and soils have had the time to rest.
This elegant system is threatened. It is threatened by the private property system, which erects barbed wire and attracts outside investors. It is threatened by a growing population on shrinking open spaces. It is threatened by invasive alien species that colonize the best grazing spots.
We support Justdiggit and SORALO to map degrading rangeland. We created a birds-eye overview of the landscape that, jointly with community inputs, is the base for an action plan to build resilience in the rangeland ecosystem.
Alright, but what is “degrading rangeland”?
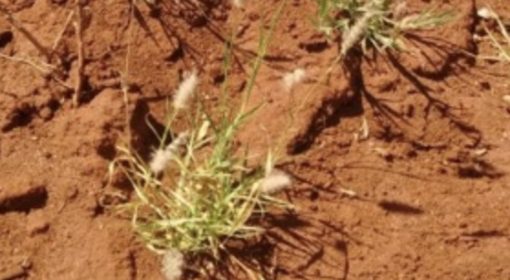
Communities have a fluid understanding of rangeland conditions. SORALO ran four workshops with different communities, and the leitmotif seems to be that rangeland degradation occurs when rangeland quality is diminished. Examples of reduced quality are reduced vegetation re-bounce after (the same amount of) rain or the increasing absence of a specific nutritious grass species. The leading identified causes are weeds invasion, grazing pressure, and poor land tenure arrangements.
Our satellite analysis is helpful to look at the consequences of these dynamics. We mapped out areas that stay bare for long. Remember that we are in a landscape where the grass level fluctuates with the seasons. It is usual for the ground being bare for some months. Good rangeland would tendentially be covered by grasses again when it rains. On the contrary, degraded rangeland may show a decreased capacity of restoring grass cover.
The results are two maps:
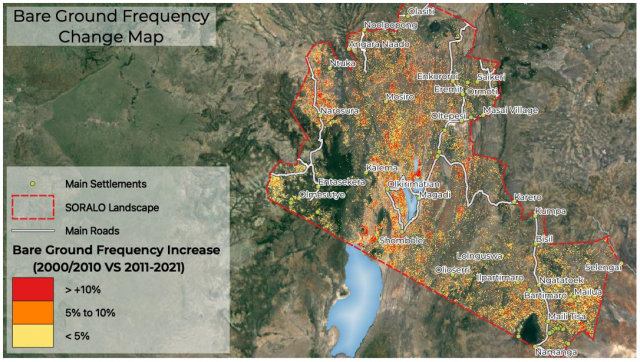
The first one shows the number of times each point in the map was identified as bare. We call it bare ground frequency.
However, to understand changes in time, we decided to compare the bare ground frequency in the decade 2000-2010 with 2011-2021. This allows us to estimate if the landscape built up a tendency to stay bare in the most recent years (see Map below). In some places it did.
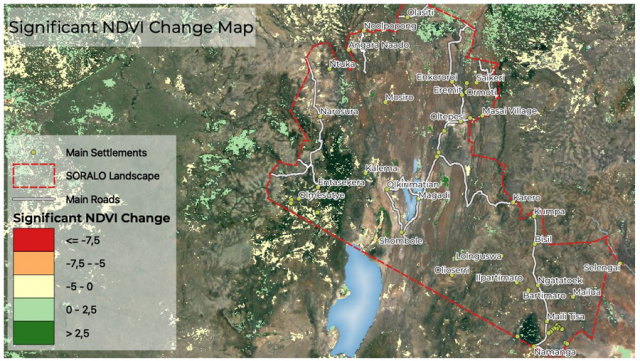
That’s how we looked at bare ground dynamics in time and space. However, the flip side of the medal is to look at how vegetation dynamics behaved in the same area. To do so, we took the MODIS calibrated time series to create the second set of maps. We estimated vegetation indices such as NDVI, EVI, and NPP for each growing season between 2000 and 2020, and checked whether they showed a statistically significant trend change.
We spotted some areas in the landscape with a decreasing trend as well as areas with an increasing trend. This second analysis picks up particularly well changes in land cover such as farmland conversion, expanding settlements, and shifting vegetation due to meandering rivers (see Map below).
The mapping was followed by field validation. In July 2021, we explored most parts of SORALO’s landscape with the printed maps in our hands and discussions with key informants and other community members. We noticed that field observations matched our mapping outputs.
A few interesting trends were detected:
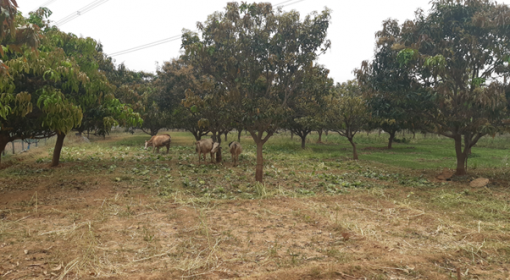
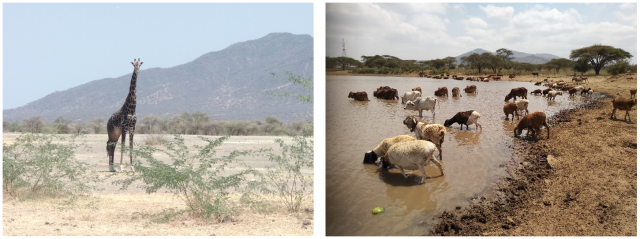
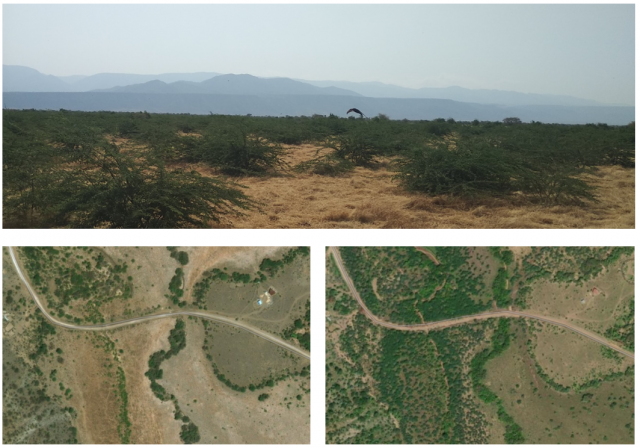
- A significant proportion of land that results greener than before is due to the invasive encroachment by the Prosopis juliflora, an evergreen bushy tree that takes over prime grazing areas (see Figure 3).
- More substantial rangeland degradation occurs closer to roads, settlements, and in areas where fences are being erected, restricting the available rangeland area.
- Agricultural development is encroaching the rangeland in the westernmost and easternmost flanks of the landscape, thus increasing bare ground frequency.
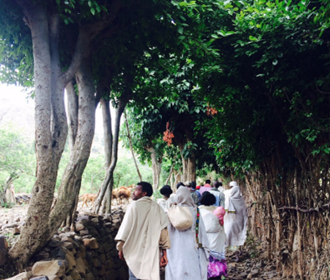
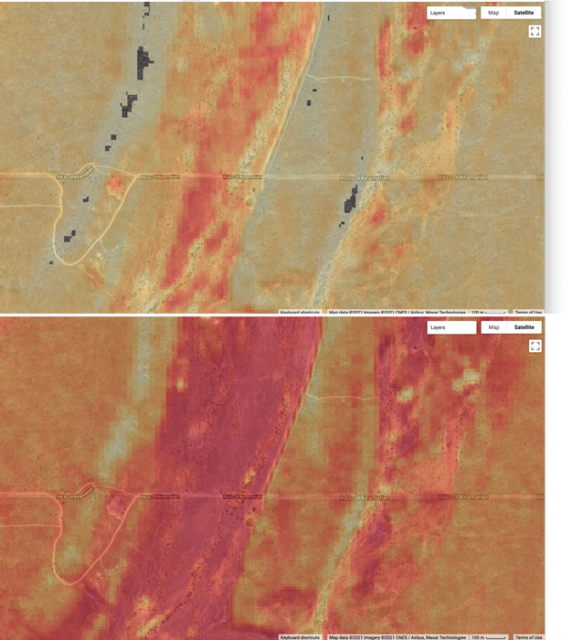
A common feature in the area between lake Magadi and the bottom of the rift valley is the presence of parallel narrow valleys separated by rocky ridges. These valleys are used seasonally by the community as livestock corridors (see figure below) to move between one area and the next one. They show a higher bare ground frequency increase than other places (see Figure 4).
Rangeland health is an elusive concept that various actors can perceive differently. Although solely focused on vegetation cover and bare ground occurrence, our tool showed a good match with both field observations and community inputs. The tool worked well to identify potentially critical areas, facilitate discussions on what was happening where and why, and ultimately identify some priority areas for restoration. The same tool can be adapted to cover other regions where extensive livestock rearing is the primary livelihood strategy.