By Rahma Brini, Abdelhamid Mnajja, Mourad Ben Amor, Nabil Rehaiem, and Yosri Gafsaoui
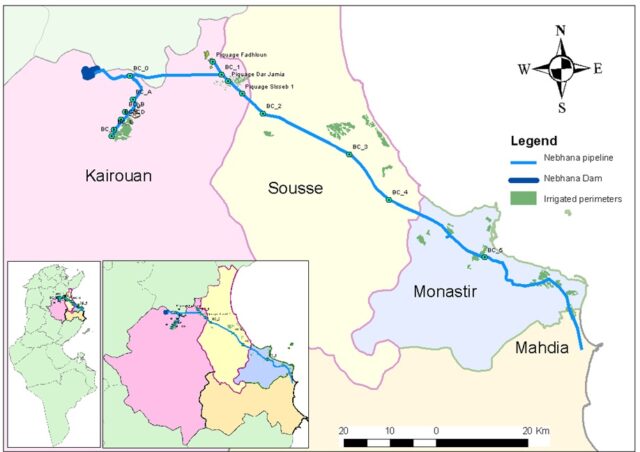
Climate change and watershed degradation are taking their toll on Tunisia’s water system. Here is the story of the Nehbana Dam system, one of the most important hydraulic systems in Tunisia, and one that has been excessively studied. Initially, the public irrigated perimeters (PIPs) irrigated from the Nebhana dam system numbered 11, but over the years the system was expanded, and the number of PIPs increased to 32, with the dam capacity increasing to deliver 30 Mm3. As it stands now, the system provides water for 7000 hectares of irrigated perimeters in Kairouan, Sousse, Monastir, and Mahdia Governorates, as well as supplies drinking water to the coastal region.
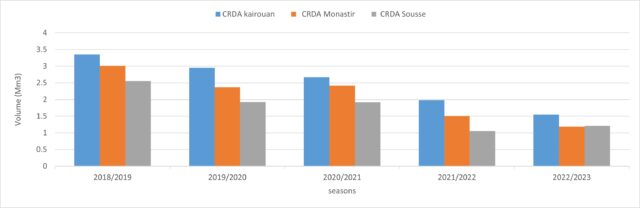
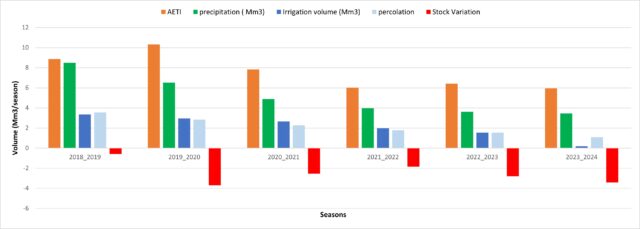
Water supply for the irrigated perimeters has fluctuated year to year, but in the last five years, there has been a dramatic declining trend (Figure 1).
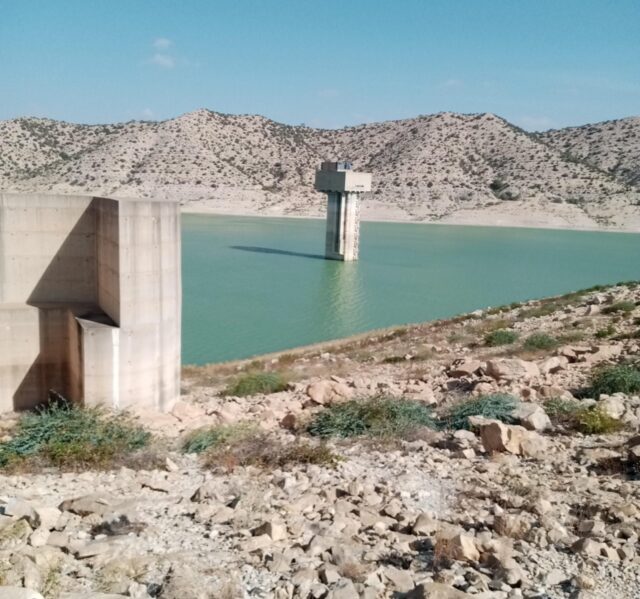
Then this year, the Nebhana Dam Water Level fell below safety levels, and surface water supplies came to a halt. Even so, farmers have continued to produce. How was this possible?
It was possible by relying on the other main source: groundwater. Groundwater was always used in the irrigated perimeters, but it was invisible and not on the radar. The dramatic drying up of the surface supplies, however, in one strike underlined the importance of groundwater for irrigated agriculture in Kairouan, Sousse, Monastir, and Mahdia.
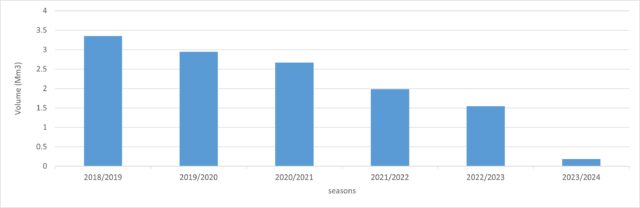
Here we zoom into the Kairouan Governorate. Based on data from Secadenord (Northern Channel and Pipe Exploitation Company), the volumes of surface water from Nebhana allocated for irrigation have been decreasing year after year, dropping from 3.3 million cubic meters in 2018/2019 to almost minimal 0.18 million cubic meters in 2023/2024. (Figure 2)
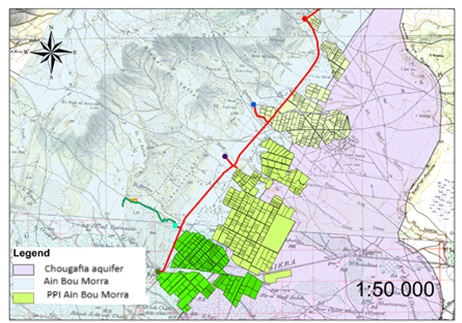
The spatial distribution reveals variations in water consumption between different perimeters in the Governorate. The irrigated perimeters of Sisseb and Dar Jamiaa are the most affected by water shortages. Notably, between 2018 and 2023, the Sisseb and Dar Jamiaa perimeters witnessed a decrease in average water availability from 400 mm/season to 200 mm/season. In contrast, the Ain Bou Mora perimeter is less impacted. Despite the ongoing water shortage, the irrigated perimeter of Ain Bou Morra continues to exhibit significant water consumption. This resilience is primarily due to its location between two major aquifers: the Ain Bou Morra and Chougafia aquifers. Farmers in this region rely on these groundwater sources to meet their irrigation needs.
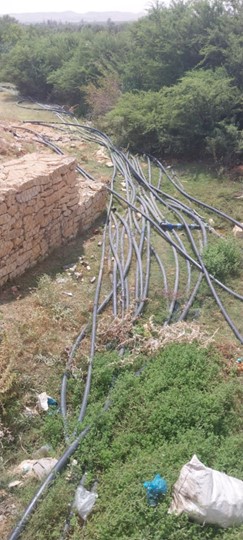
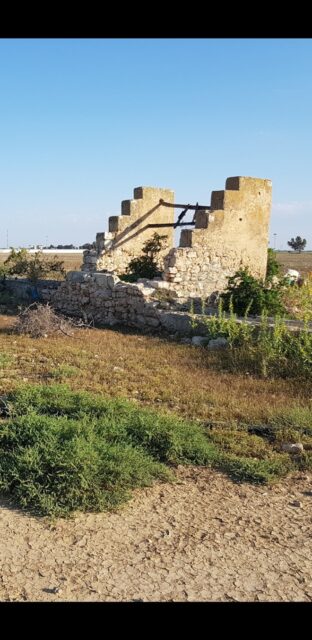
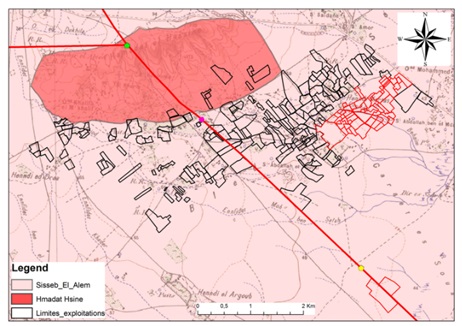
In contrast, the perimeters of Sisseb and Dar Jamiaa are located within the Sisseb aquifer. These areas were once supplied by boreholes tapping into the aquifer, but following the depletion of the Sisseb aquifer, they now rely only on dam water. With all the boreholes in the area having dried up, groundwater is no longer available. This region, known as ‘Hamadet Hassine,’ is particularly affected by the severe water shortage.
Using rainfall data and evapotranspiration data from WaPOR on water consumption, an effort was made to quantify the consumption of groundwater over the last five years in Khairouan Governorate. The variation in groundwater storage was estimated to be approximately 3.4 million cubic meters (Mm³). Depletion ranges from 0.5 million cubic meters (Mm³) to 3.6 Mm³, depending on factors such as water availability in the dam, rainfall, and cropped area. Groundwater use, hence, more or less makes up the shortfall in surface water supplies.
This analysis shows that the volumes abstracted from groundwater are massive. The groundwater abstraction is particularly significant given the severe deficit at the dam, even almost entirely compensating for the lack of supplies this year. The shortage of surface water did not mean that farmers had adapted efficiently to water scarcity: they just substituted surface water with groundwater. This resilience comes in an unsustainable manner. The lack of groundwater monitoring should not obscure the severity of the situation. Current conditions are very challenging, and uncontrolled use of aquifers may give temporary respite, but after that will have serious consequences.
Important urgent action is needed. First is to set in place a system of groundwater monitoring – assessing groundwater abstraction and changing groundwater levels over the season. This should be an exercise involving all those involved, including the farmer leaders, local government, and society at large. What is at stake is not the current crisis, but a perpetual demise of the area. The groundwater information may be used to collectively plan cropping systems, water supplies, and recharge measures – to restore the balance in the water system – of both surface and groundwater. The second important action is to manage the surface and groundwater supplies in the area conjunctively: to plan the use of groundwater when there is a shortfall in surface supplies (as in this year), but also use surface irrigation supplies to recharge groundwater, especially the shallow aquifer immediately underneath the irrigated perimeters, where possible. The 2024 dry spell has been an important wake-up call, and hopefully a turning point in effective and integrated water management, giving as much weightage to groundwater as to surface water.
Appendix: Calculating groundwater usage in Kairouan Governorate
To highlight the importance of groundwater use, we chose the Kairouan region because of its depleted aquifers. To better understand and quantify the amount of groundwater being abstracted. An analysis was conducted based on the water balance equation as follows:
ΔS=P+I−ETa−DP (equation 1)
- Precipitation (P): Water entering the system from rainfall.
- Irrigation (I): Additional water supplied by irrigation systems.
- Actual evapotranspiration (ETa): Water lost to the atmosphere through transpiration by plants and evaporation from the soil and water surfaces.
- Deep Percolation (DP): Water that moves through the soil beyond the root zone and recharges the aquifer
- Stock variation (ΔS): Water storage
Actual evapotranspiration (AETI) is essential for estimating agricultural water usage, particularly in regions with incomplete or unavailable data, such as in our case. Using WaPOR data, AETI was estimated, and Figure 2 illustrates the spatial distribution of seasonal water consumption across five seasons (2018-2019, 2019-2020, 2020-2021, 2021-2022, and 2022-2023). The average AETI values for each season are as follows: 461.6 mm in the first season, 537.3 mm in the second, 407.3 mm in the third, 313.2 mm in the fourth, and 334.4 mm in the fifth.
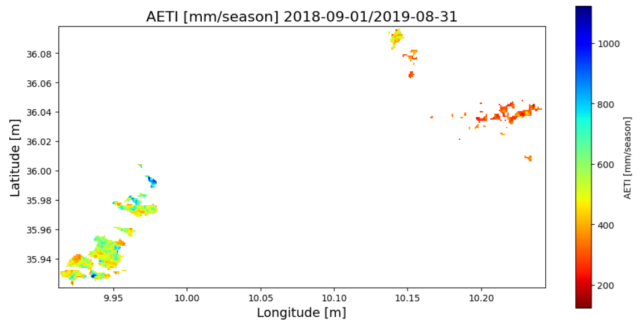
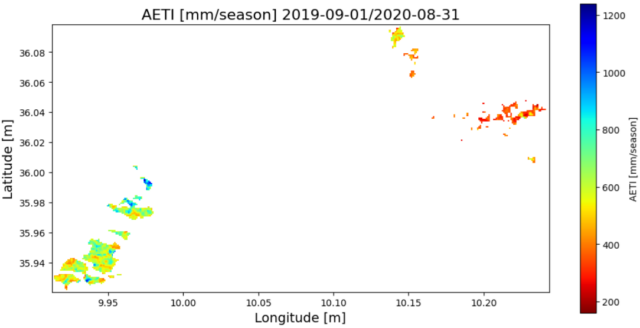
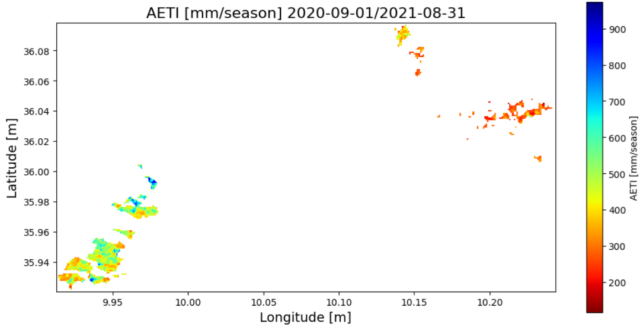
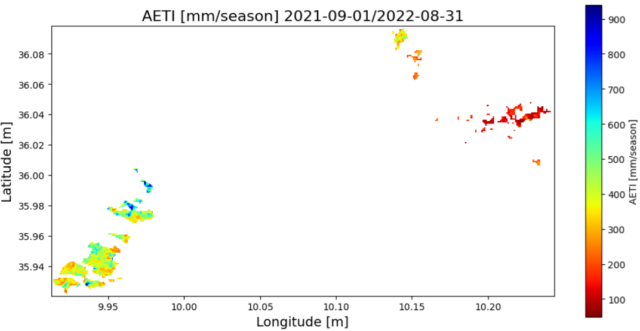
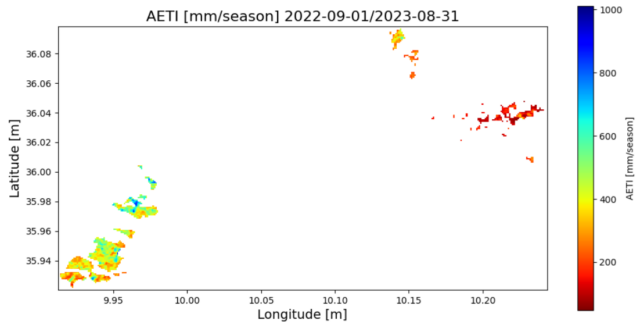
The spatial distribution reveals variations in water consumption between different perimeters – see the circles in Figure 4. The irrigated perimeters of Sisseb and Dar Jamiaa (shown in black) are the most affected by water shortages, while Ain Bou Mora (shown in orange) is less impacted. Notably, between 2018 and 2023, the Sisseb and Dar Jamiaa perimeters shifted from orange to red, indicating a decrease in average water availability from 400 mm/season to 200 mm/season. Despite the ongoing water shortage, the irrigated perimeter of Ain Bou Morra continues to exhibit significant water consumption. This resilience is primarily due to its location between two major aquifers: the Ain Bou Morra and Chougafia aquifers. Farmers in this region rely on these groundwater sources to meet their irrigation needs.
In contrast, the perimeters of Sisseb and Dar Jamiaa are located within the Sisseb aquifer. These areas were once supplied by boreholes tapping into the aquifer, but following the depletion of the Sisseb aquifer, they now rely only on dam water. With all the boreholes in the area having dried up, groundwater is no longer available. This region, known as ‘Hamadet Hassine,’ is particularly affected by the severe water shortage. (Figure 5)
Irrigation: Based on data from Secadenord (Northern Channel and Pipe Exploitation Company), the volumes allocated for irrigation have been decreasing year after year, dropping from 3.3 million cubic meters in 2018/2019 to 0.18 million cubic meters in 2023/2024
Precipitation: We calculated the average rainfall based on data from pluviometric stations
Deep percolation: The return flow is estimated to be 30% of the applied water.
Storage variation: Aquifer Extraction or Change in Storage is estimated by this equation
(ΔS) =P+I−ETa−DP (equation 2)
- If ΔS is negative, it suggests depletion of the aquifer (extraction > recharge).
- If ΔS is positive, it indicates an increase in storage (recharge > extraction).