Using Google Earth in urban community engagement
Esmee Mulder
April 21, 2021
Whether we are talking about natural resources management, health, or gender issues, when trying to improve the situation ‘on the ground’ it is essential to work closely with those who should ultimately benefit from it. We should learn from those who live in the situation every day which we are trying to improve. Only by understanding what the situation is like, we can dig deeper into why things do or do not work and what potential solutions can be. It is their reality that counts. Similarly, when looking for solutions, it is essential to hear ideas from the people who are living in the specific circumstances. Do they already have ideas? And what do they think about your ideas? Will they work? Why or why not?
All this sounds obvious to those working in development. ‘Stakeholder engagement’ is a key tenet in most programs and ‘community engagement’ is a must do. But how much learning can really be obtained through one focus group discussion in which the topic of the 1-hour conversation is heavily steered by the facilitator? Will we truly be able to get into depth and understand what solutions will and will not work? Do the community members who participate in this discussion truly have ‘ownership’? And then how to make sure that these lessons learnt from the residents end up with the decision makers? Who will take the time to read a lengthy report in detail?
In this blog a different approach is shared regarding stakeholder engagement. In March 2021 we started to use new tools to improve the inclusion of the ‘voice of the resident’ in urban planning. These residents took us along on a journey through their neighborhoods. They made us look through their eyes. And better yet, they captured their stories and ideas in such a way that we could share it with other key stakeholders and decision makers who may not have the time or the ability to travel to their neighborhoods, but who do make major decisions which influence the quality of life in these neighborhoods. Meet two platforms through which local knowledge and outer space can be connected: Google Earth combined with Kobo Toolbox.
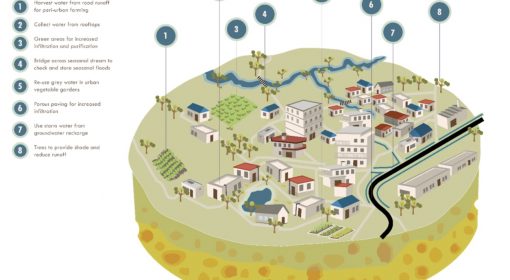
The program for which this approach was piloted is called Sponge Town Nakuru. Nakuru town, located in Kenya 3 hours’ drive from Nairobi, experiences flooding in the rainy seasons and water shortages in the dry seasons. As one person put it: “Why do we look at the water flow past us in floods when it rains, only to chase it afterwards with donkeys when the rains have stopped?” Why not capture the water when it arrives and store it for when we need it again?
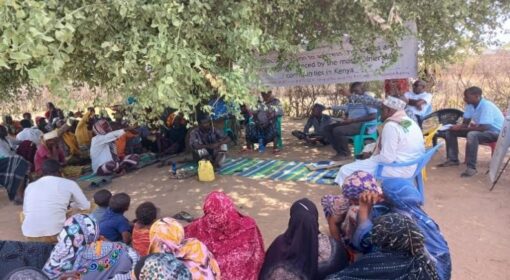
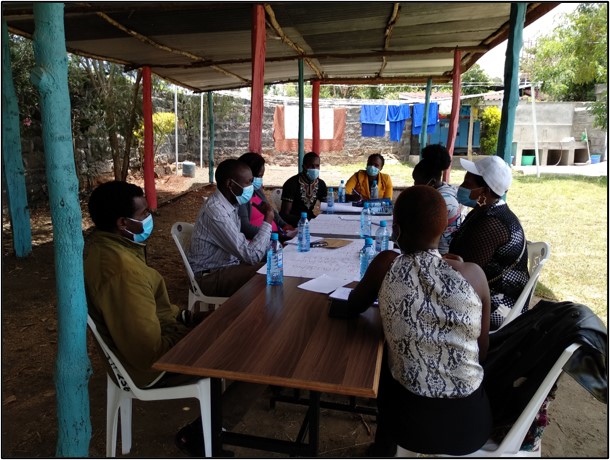
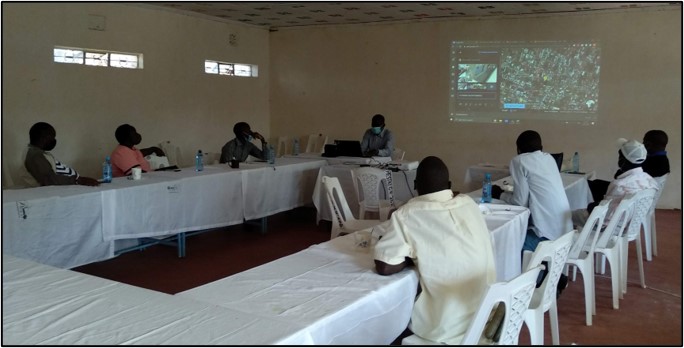
Flooding and water shortage particularly occur in the low-income areas in the wards Kaptembwo, Free Area, and London. We had detailed discussions with residents from these areas on the two topics and the concept of ‘sponge towns’ – applying 3R (reuse, recharge, retain) in the town to reduce these issues. These discussions were held with several community groups who were formed by residents to create change in their neighborhood and included residents from different backgrounds, abilities, age groups, and gender. The discussions included an introduction of the sponge town concept, brainstorm sessions, and planning sessions using maps of the areas.
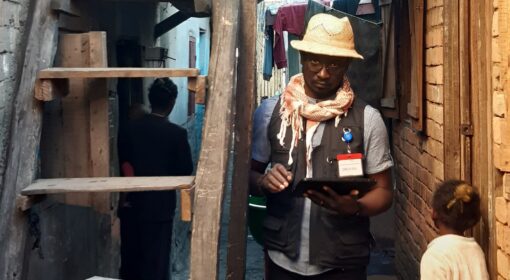
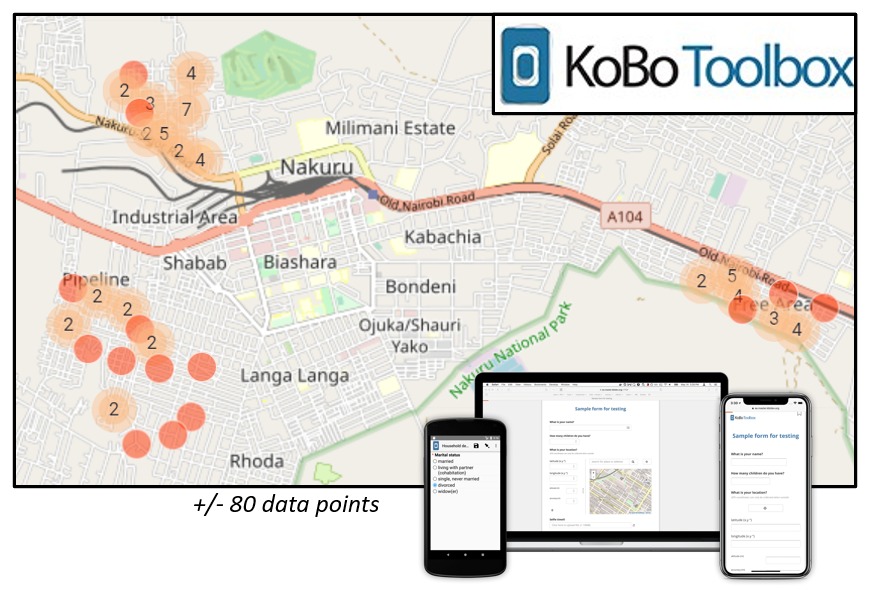
After these discussions the residents traversed their neighborhoods in small groups armed with their phones and tablets to share what specific issues related to flooding and water shortage occur. However, whilst it is often easy to find what is wrong, it is more challenging to find out what to do to alleviate the problems. Therefore, when reporting on the issue, the ward residents also came up with potential solutions. These stories and ideas were collected through an app called KoBo Toolbox in which each story includes a GPS point and can be reported through photos, videos and/or text. These information points were then transferred to Google Earth to result into a dynamic and visual map. Google Earth is known by many as an interactive map of the world to zoom in and out of areas which can be observed through highly detailed satellite images. However, the platform also includes a feature to make your own ‘project’. This project creation tool is very user friendly and was used by the residents to turn their collected KoBo Toolbox data points into a cohesive story. They selected the most relevant pictures and videos and added descriptions. The viewer of this story can now click on ‘next’ and in doing so follow the residents on their walk through their neighborhoods zooming in and out of areas with major issues and areas with great opportunities for improvements.
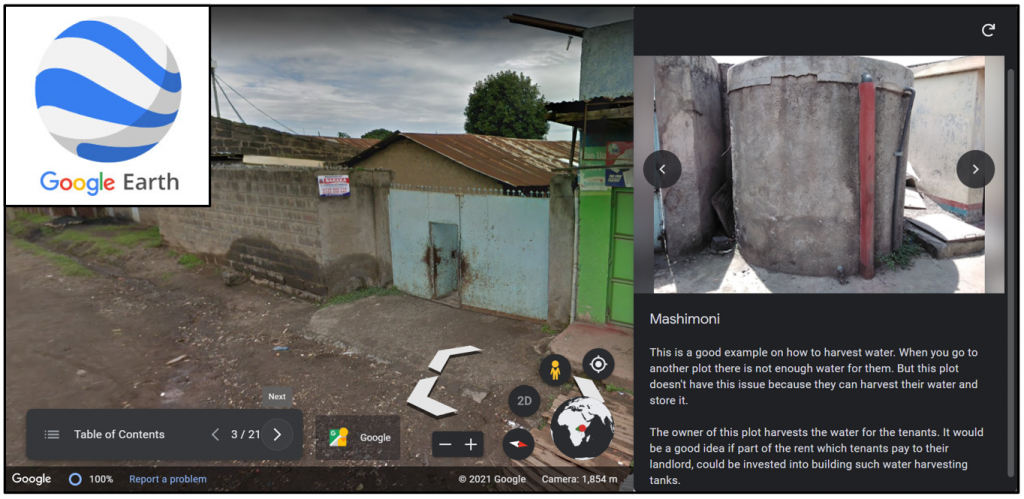
Join the residents of Kaptembwo, Free Area and London on a journey through their neighborhoods, sharing the problems and solution in flooding and water retention, by clicking here. You can easily open this link on your computer, or if you prefer opening it on your phone it will direct you to the Google Earth app which you will need to download before you can view the story. Once you have opened the link, next to ‘Table of Contents’ in the bottom left, you will see ‘1/22’ with two arrows: < and >. If you click on >, you can move through the story.
DO’s
What are the lessons from this journey with the residents of Nakuru through their neighbourhoods, through Google Earth and back?
If you decide to use a similar approach there are some things we would recommend:
- Split the residents into small groups of maximum 3 people so that everyone is engaged and that the group can work together to decide what issues in the neighbourhood should be recorded
- Within these groups, make sure to have at least one participant who is familiar with smartphones and apps, for example youth who live in the neighbourhood.
- After the data collection, let the residents choose a selected number of points to talk about. In our case we agreed on 5 points per neighbourhood (out of more than 20). If you include all points, the story may become too long and one may lose the audience. The discussions can take place with subgroups combined (e.g., 3 groups of 3 of the same neighbourhood).
- Let the residents write the story themselves so that it is truly their story. Of course, one may help the discussion to ensure it does not go off topic and to probe for more depth.
- After the story is created, save a copy of it and share this copy (including editor rights) with the participants so that they can continue to edit it and have access to it.
When to use this method?
This method can be used throughout different phases of a development venture. It is an inspiring tool in the project formulation phase (as used in the Sponge Town Nakuru project) to ensure collaboration, ownership and valuable input from the participants straight from the start. Next, it can be used to track the progress of the project, to monitor the project and evaluate it. Especially if the participants have their own smartphones this can be done continuously to see where the project needs to be tweaked and identify where things are not working out as planned.
Finally, it is a great method for reporting. It is often more enjoyable and engaging to journey through a google earth story than to get stranded in a 10,000-word report…
Inspired? Ideas or feedback? Feel free to drop your thoughts, stories or questions in an email to emulder[at]metameta[dot]nl